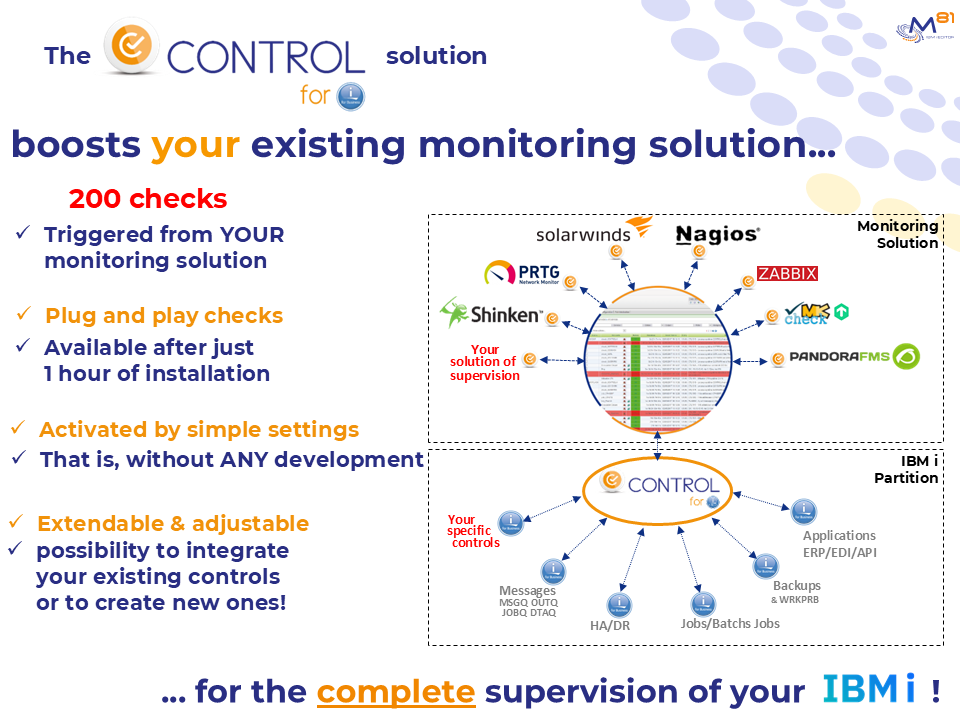
You continue to use YOUR existing monitoring tool, with your USUAL graphic interface.
We provide a plugin with ‘Control For i’ which enables the connection between your existing monitoring tool and the IBM i partition.
The only input parameter is an IBM i command which will be executed on the IBM i partition. The message returned from this command will be the text displayed by Nagios or sent by e-mail if it concerns an error. No development at all is required!
The product is supplied with numerous check commands which cover most of needs related to IBM i System, IBM i Applications and Middleware operations.
The commands can of course be used interactively in a 5250 session to test and validate a check (or in a CLP program written by the user).
All the commands are written to be executed extremely quickly in order to avoid timeouts during checks performed by your monitoring tool.
With 200 Plug & Play controls provided, more than 95% of our customers needs are covered.
But in some cases, a specific control is still needed. We provide templates to create new ‘CONTROL for i’ commands, that will be used as well by your monitoring tool.
On the IBM i partition, an agent is running permanently. Its role is to accept requests from your monitoring tool, and to return the answer (with relevant message).
The scheduling and the frequency of the controls are managed by your existing monitoring tool.
The ‘Control for i’ product is available in English and French versions.
.


